Compute daily evolution of a stock investment portfolio by using only built-in functions of Google Sheets
To effectively track a stock investment portfolio, it is necessary to know its evolution in the past. As I use Google Sheets to track my stock investment portfolio, I have researched and successfully implemented several solutions. In this post, I am happy to share in detail how to compute the daily evolution of a stock investment portfolio by simply using only the available built-in functions in Google Sheets.

Table of Contents
- Concept
- Implementation
- Register transactions of a stock investment portfolio
- Optimally use the GOOGLEFINANCE function to fetch historical prices of stocks
- Formula to determine the (close) price of a stock on a given day
- Formula to determine the number of shares that a stock presents in the portfolio on a given day
- Design the sheet for storing the daily evolution of a stock investment portfolio
- Getting started
- Demo
- Conclusion
- Disclaimer
- Feedback
- Support this blog
- Share with your friends
Concept
A stock investment portfolio consists of several different stocks. The composition of a portfolio changes over time depending on the frequency of transactions. At any time, it is necessary to answer the three questions below to determine the market value of an equity investment portfolio:
- What stocks were present in the investment portfolio?
- How many shares did each stock present in the investment portfolio?
- What was the price of each stock?
The three questions can be answered with Google Sheets because:
- As I use Google Sheets to register all transactions of my stock investment portfolio, it is easy for me to determine the composition of my portfolio at a given time.
- The GOOGLEFINANCE function allows fetching the historical prices of stocks in Google Sheets.
It means that computing the historical evolution of a stock investment portfolio in Google Sheets is not an impossible mission. However, there are still several technical challenges concerning its implementation:
- The repetitive use of the GOOGLEFINANCE function to fetch prices of stocks might decrease the performance of a spreadsheet.
- What is the most suitable design of the sheet for storing the daily evolution of a stock investment portfolio?
- What are the available built-in functions that can be helpful?
- How to automatically compute the market value of a new day?
- etc.
In the following sections, I explain in detail the solution for computing the daily evolution of a stock investment portfolio by simply using the available built-in function in Google Sheets.
Implementation
Register transactions of a stock investment portfolio
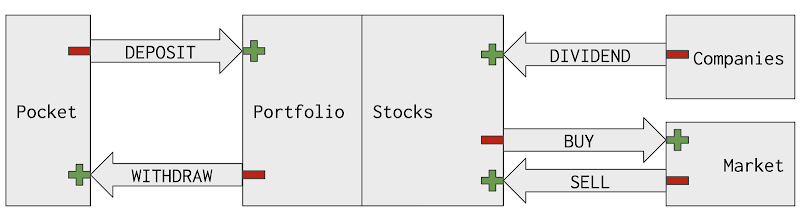
To compute the historical evolution of a stock investment portfolio, its transactions must be carefully registered from the beginning. I create the Transactions sheet to keep track of my investment portfolio's transactions. In that sheet, a row represents essential information about a transaction: the date, the type (BUY, SELL, DEPOSIT, WITHDRAW, and DIVIDEND), the symbol of the involved stock, the amount of money, and the number of shares.
I explained the further details in the post how to manage stock transactions with Google Sheets

Optimally use the GOOGLEFINANCE function to fetch historical prices of stocks
To compute the historical evolution of a stock investment portfolio, I need to use the GOOGLEFINANCE function to fetch the historical prices of my stocks in Google Sheets. However, the repetitive use of the GOOGLEFINANCE function can cause performance issues for the spreadsheet, especially when it comes to many stocks and many dates. To avoid that, I create a dedicated sheet for each stock, then call the GOOGLFINANCE function only once to get its historical price and store the results in that sheet. After that, I will query that sheet to search for the price on the date that I need.
For example:
- I started my stock investment portfolio on 27/12/2017.
- I own the EPA:TTE stock and I create a sheet named EPA:TTE.
- On the cell A1 of that sheet, I put the formula =GOOGLEFINANCE("EPA:TTE", "price", DATE(2017,12,27), TODAY(), "DAILY") to get the daily historical prices of the EPA:TTE stock since 27/12/2017 to today.
- When I need the price of the EPA:TTE stock on any given date, I will use built-in functions of Google Sheets to lookup the corresponding price in the sheet EPA:TTE instead of using the GOOGLEFINANCE function again. By doing so, I optimize the performance of my spreadsheet.
For many other useful tips for working with the GOOGLEFINANCE function in Google Sheets, check out my post GOOGLEFINANCE Best Practices
Formula to determine the (close) price of a stock on a given day
Continuing with the example for the EPA:TTE stock, concretely, to know its close price on 01/11/2022, I will use the QUERY function as follow:
=QUERY('EPA:TTE'!A:B,"select B where datediff(A, date '2022-11-01')=0 limit 1",0)
There are some reasons why I need to use the QUERY function here instead of the VLOOKUP function. I explained those reasons at the section Use QUERY function instead of VLOOKUP function for looking up by date of the post GOOGLEFINANCE Best Practices.
Formula to determine the number of shares that a stock presents in the portfolio on a given day
To know the number of shares of a stock that I own on a given day, I need to do two steps:
- Firstly, I need to identify all the BUY and SELL transactions of that stock before or on that day. For that, I will use once again the powerful QUERY function.
- Secondly, I need to sum up all the shares of those identified BUY or SELL transactions. For that, I will the classic SUM function.
Continuing with the example for the EPA:TTE stock, concretely, to know how many shares of the the EPA:TTE stock that I own on 01/11/2022, I will use the QUERY function and the SUM function as follow:
=SUM(QUERY(Transactions!$A:$E,"select E where C='EPA:TTE' and B != 'DIVIDEND' and A <= date '2022-11-01'"))
Design the sheet for storing the daily evolution of a stock investment portfolio
So far, I have managed to determine the close price and the number of shares for the EPA:TTE stock on 01/11/2022. Therefore, it is an easy task to know how much value the EPA:TTE stock contributes to my investment portfolio on 01/11/2022. For that, I simply multiply the number of shares by the close price.
To know the total market value of my investment portfolio on 01/11/2022, I need to repeat the process for other stocks that I held on that day.
I then need to repeat again on other days to compute my investment portfolio market value on those days.
How should I design the Evolution sheet to ease the computation?
There are 2 main variables: the stocks and the dates. Therefore, I think of the design where:
- The header row contains the stocks.
- The header column contains the dates.
- Just after the header column, I create a column Portfolio Market Value

Getting started
- Make a copy of the demo spreadsheet below
- Replace your own transactions in the Transactions sheet as explained in the post how to manage stock transactions with Google Sheets
- Create a Evolution sheet
- Use the column A for Date and put the wanted dates to this column. The values must be of type Date
- Use the column B for Portfolio Market Value
- On the cell C1, put the formula
=TRANSPOSE(UNIQUE(QUERY(Transactions!A:F,"select C where B='BUY' order by A desc",0))), so that all the available stocks in the investment portfolio will be populated on the first row, starting from the column C - On the cell C2, put the below formula then apply it by dragging from the cell C2 to other cells starting from the column C and the row 2
=IF(SUM(QUERY(Transactions!$A:$E,"select E where C='"&C$1&"' and B != 'DIVIDEND' and A <= date '"&TEXT($A2,"yyyy-MM-dd")&"'"))>0,SUM(QUERY(Transactions!$A:$E,"select E where C='"&C$1&"' and B != 'DIVIDEND' and A <= date '"&TEXT($A2,"yyyy-MM-dd")&"'"))*QUERY(INDIRECT(C$1&"!A:B"),"select B where datediff(A, date '"&TEXT($A2,"yyyy-MM-dd")&"')=0 limit 1",0),0)
- On the cell B2, put the formula
=SUM(C2:2)and then apply it to the whole column B
Demo
Another solution for computing the daily evolution of a stock investment portfolio is to write a scripting program with Google Apps Script. Although that solution requires programming, it can compute the evolution of a stock investment portfolio for a longer period. For more information, I have explained in detail in the post Compute daily evolutions of a stock portfolio with Google Sheets and Apps Script

Conclusion
In this post, I have explained in detail how to compute the daily evolution of a stock investment portfolio by simply using the available built-in function in Google Sheets. The post covered many topics:
- How to manage transactions of a stock investment portfolio with Google Sheets
- How to optimally use the GOOGLEFINANCE function in Google Sheets
- How to use the QUERY function in Google Sheets as well as other functions like SUM, INDIRECT, TRANSPOSE, UNIQUE, DATEDIFF
Disclaimer
The post is only for informational purposes and not for trading purposes or financial advice.
Feedback
If you have any feedback, question, or request please:
- leave a comment in the comment section
- write me an email to allstacksdeveloper@gmail.com
Support this blog
If you value my work, please support me with as little as a cup of coffee! I appreciate it. Thank you!

Share with your friends
If you read it this far, I hope you have enjoyed the content of this post. If you like it, share it with your friends!


Thank you for your work. What if you have stocks in USD, GBP and EUR. Would you convert to local currency on the stock daily prices or in the sheet "last 52 weeks" ?
ReplyDelete