When it comes to investment, it is not only important to know the up-to-date state of portfolio but also to track its evolution day by day. We need to know on a specific day, how much money has been invested in the portfolio, the current market value of owned shares, the available cash and the current profit. Visualizing those historical data points on a time-based graph helps us to identify which transactions were good and which were bad. This post shows how to compute automatically those historical data points by using data in Transactions sheet and the built-in GOOGLEFINANCE function of Google Sheets. A sample spreadsheet can be found in this post Demo stock portfolio tracker with Google Sheets. You can take a look at the sample spreadsheet to have an idea of how the data is organized and related. It is possible to make a copy of the spreadsheet to study it thoroughly.
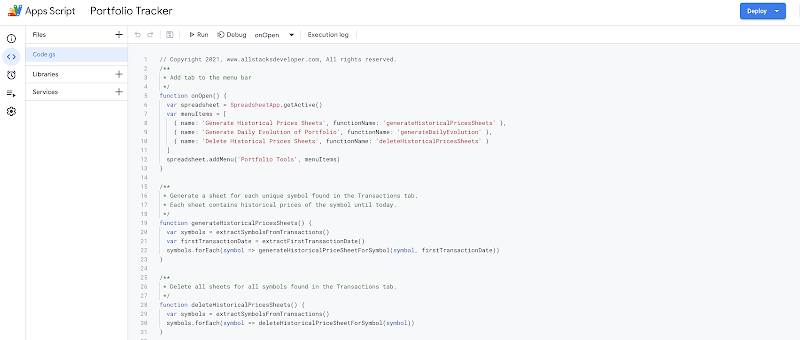
Table of Contents
- Concept
- Fetch historical data with GOOGLEFINANCE
- Automate with Apps Script
- Schedule daily
- Conclusion
- TLDR
- Note
- How to compute the daily evolution of a stock investment portfolio by simply using only the available built-in functions in Google Sheets
- References
- Disclaimer
- Feedback
- Support this blog
- Share with your friends
Concept
We need to compute daily historical data points for the portfolio from its first transaction date until today. A data point consists of:
- Date: Run from the first transaction date until today
- Invested Money: The amount of DEPOSIT money minus the amount of WITHDRAW money so far until that date
- Cash: The amount of money available in the portfolio that can be used to buy more shares
- Market Value: The value of current owned shares based on their closing prices on that date
- Portfolio Value: The sum of Market Value and Cash
- Gain: The difference between Portfolio Value and Invested Money
As every transaction is registered, it is easy to know on a specific day:
- Invested Money: It is the sum of the amount of DEPOSIT and WITHDRAW transactions until the date.
- Cash: It is the sum of the amount of all transactions until the date.
- The number of shares for a given stock: It is the sum of shares of BUY and SELL transactions for that stock until the date.
| Date | Type | Symbol | Amount | Shares |
| 15/01/2018 | DEPOSIT | 1,000.00 | ||
| 25/01/2018 | BUY | EPA:SEV | -495.71 | 42 |
| 24/02/2018 | DEPOSIT | 300 | ||
| 26/03/2018 | DEPOSIT | 300 | ||
| 25/04/2018 | DEPOSIT | 400 | ||
| 04/05/2018 | BUY | EPA:MMT | -354.6 | 17 |
| 11/05/2018 | BUY | EPA:MMT | -488.24 | 24 |
| 16/05/2018 | DIVIDEND | EPA:MMT | 38.95 | 41 |
| 22/05/2018 | DIVIDEND | EPA:SEV | 27.3 | 42 |
| 21/06/2018 | DEPOSIT | 400 | ||
| 21/07/2018 | DEPOSIT | 400 | ||
| 20/08/2018 | DEPOSIT | 400 |
For instance, with the transactions above, we can compute the position on the date 01/07/2018:
- Only the first 11 transactions are used because they were executed before 01/07/2018.
- Until 01/07/2018, we have deposited 5 times with total Invested Money of 2400.
- Until 01/07/2018, we have spent 1338.55 to buy shares and have received 66.25 in terms of dividends. Totally, it remains
2400 - 1338.55 + 66.25 = 1127.70in Cash. - On 01/07/2018, there were 2 stocks in the portfolio, with respectively: 41 shares for MMT and 42 shares for SEV.
The only missing parameters are closing prices for MMT and SEV on 01/07/2018. If we have those prices, we can know their Market Value on that date, and eventually the Portfolio Value as well as the Gain on that date
Fetch historical data with GOOGLEFINANCE
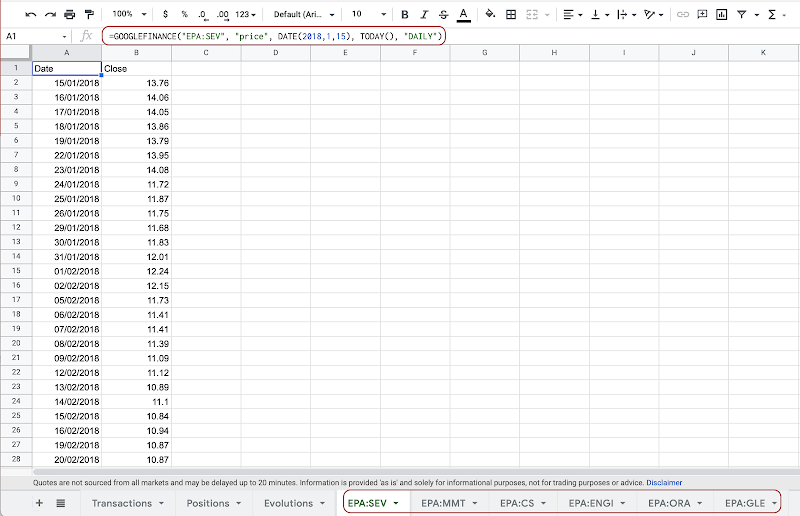
With GOOGLEFINANCE it is not only possible to get the latest price for stock but also to query its historical prices. For example, to fetch historical prices for MMT and SEV from the first transaction date of the portfolio, which is 15/01/2018, we can use the 2 functions below:
=GOOGLEFINANCE("EPA:SEV", "price", "15/01/2018", TODAY(), "DAILY")=GOOGLEFINANCE("EPA:MMT", "price", "15/01/2018", TODAY(), "DAILY")
The result is presented in 2 columns, one is Date, the other is Close.
At this point, we have found the missing parameters in order to finish the computation for the position of the portfolio on 01/07/2018.
- On 01/07/2018, the close price for MMT was 17.13. The owned 41 shares worthed so 702.33.
- On 01/07/2018, the close price for SEV was 11.11. The owned 42 shares worthed so 466.62.
- On 01/07/2018, the Market Value was
702.33 + 466.62 = 1168.95 - On 01/07/2018, the Portfolio Value was
1168.95 + 1127.70 = 2296.65 - On 01/07/2018, the Gain was
2296.65 - 2400 = -103.35
Until this point, you might have already wondered that it requires a certain amount of detailed manual works in order to compute just only one position of the portfolio on 01/07/2018. In a long-term investment, it may involve many dates and maybe many different stocks, and nobody wants to spend precious time to calculate manually historical points of the portfolio.
Automate with Apps Script
Luckily, the Google Sheets provides script ability with Apps Script which allows the automation of process. The process we want to automate is computing daily evolutions of the portfolio from its first transaction date until today. The process consists of small sub-processes:
- For each stock presented in the portfolio, create automatically a sheet named by the symbol of the stock to store its historical prices. For example, the sheet named EPA:SEV is created to store results of the function
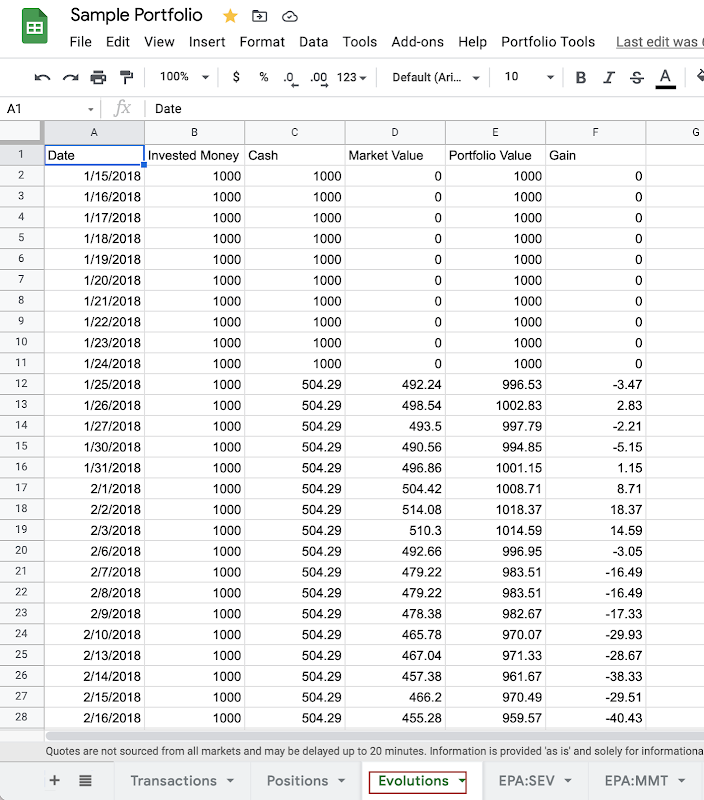
=GOOGLEFINANCE("EPA:SEV", "price", "15/01/2018", TODAY(), "DAILY"). - Compute daily evolutions and store them in a sheet named Evolutions of 5 columns: Date, Invested Money, Cash, Market Value, Portfolio Value and Gain
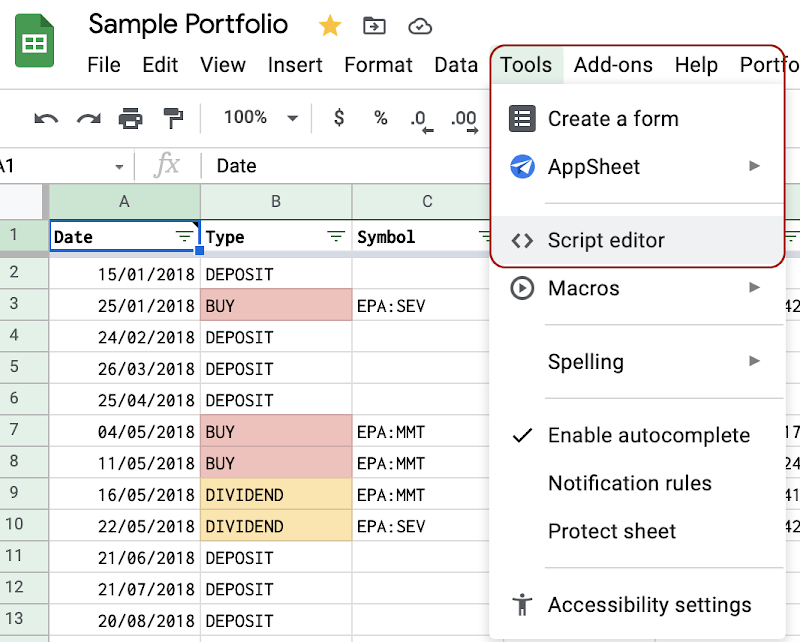
To access Apps Script editor, you need to select the menu Tools then the item Script editor on the menu bar of the Google spreadsheet.
Create a historical data sheet for each bought stock
We need to extract unique symbols from transactions and the very first transaction date.
The function extractSymbolsFromTransactions retrieves values from the column Symbol of the sheet Transactions, which is the column C starting from the 2nd row and eliminate all duplicates.
/**
 * Extract unique symbols from the Transactions sheets
 */
function extractSymbolsFromTransactions() {
  var spreadsheet = SpreadsheetApp.getActive()
  var transactionsSheet = spreadsheet.getSheetByName('Transactions')
  var rows = transactionsSheet.getRange('C2:C').getValues()

  var symbols = new Set() // Use Set to avoid duplicates
  for (var i = 0; i < rows.length; i++) {
    var symbol = rows[i][0]
    if (symbol.length > 0) {
      symbols.add(symbol)
    }
  }

  // Convert from Set to array
  return [...symbols]
}
The function extractFirstTransactionDate retrieves transactions from the sheet Transactions and sort them ascending by date and return the date of the first transaction, which is hence the first transaction date.
/**
 * Get the first transaction date from the sheet Transactions.
 */
function extractFirstTransactionDate() {
  var spreadsheet = SpreadsheetApp.getActive()
  var transactionsSheet = spreadsheet.getSheetByName('Transactions')
  var rows = transactionsSheet.getRange('A:E').getValues()

  var transactions = []
  for (var i = 1; i < rows.length; i++) {
    var row = rows[i]
    if (row[0].length === 0) {
      break
    }

    transactions.push({
      date: row[0]
    })
  }

  // Order by date ascending
  transactions.sort((t1, t2) => t1.date < t2.date ? -1 : 1)

  console.log(transactions[0].date)
  return transactions[0].date
}
The function generateHistoricalPricesSheets iterate each symbol and call generateHistoricalPriceSheetForSymbol on each one:
- Create a sheet (if not existing) and name it by the symbol
- Set the formula
=GOOGLEFINANCE(SYMBOL, "price", FIRST_TRANSACTION_DATE, TODAY(), "DAILY")on the cell A1 - Format the column A as dd/mm/yyyy
- Format the column B as #.###
/**
 * Generate a sheet for each unique symbol found in the Transactions tab.
 * Each sheet contains historical prices of the symbol until today.
 */
function generateHistoricalPricesSheets() {
  var symbols = extractSymbolsFromTransactions()
  var firstTransactionDate = extractFirstTransactionDate()
  symbols.forEach(symbol => generateHistoricalPriceSheetForSymbol(symbol, firstTransactionDate))
}
/**
 * Create a new sheet whose name is name of the symbol
 * for its historical prices until today.
 *
 * The formula below is added to A1 cell.
 * GOOGLEFINANCE("SYMBOL", "price", "1/1/2014", TODAY(), "DAILY")
 * @param {String} symbol
 */
function generateHistoricalPriceSheetForSymbol(symbol, fromDate) {
  // Create a new empty sheet for the symbol
  var spreadsheet = SpreadsheetApp.getActive()
  var sheetName = symbol
  var symbolSheet = spreadsheet.getSheetByName(sheetName)
  if (symbolSheet) {
    symbolSheet.clear()
    symbolSheet.activate()
  } else {
    symbolSheet = spreadsheet.insertSheet(sheetName, spreadsheet.getNumSheets())
  }

  let fromDateFunction = "DATE(" + fromDate.getFullYear() + "," + (fromDate.getMonth() + 1) + "," + fromDate.getDate() + ")"
  var historicalPricesFormula = 'GOOGLEFINANCE("' + symbol + '", "price", ' + fromDateFunction + ', TODAY(), "DAILY")'
  symbolSheet.getRange('A1').setFormula(historicalPricesFormula)

  symbolSheet.getRange('A:A').setNumberFormat('dd/mm/yyyy')
  symbolSheet.getRange('B:B').setNumberFormat('#.###')
}
Compute daily evolutions
The first step is to know the composition of the portfolio on a given day, which consists of Invested Money, Cash and number of shares for each stock.
- The sum of amount of all the transactions until the given date is available Cash on that date.
- The sum of amount of all the DEPOSIT and WITHDRAWN transactions until the given date is Invested Money on that date.
- The sum of shares of all the BUY and SELL transactions until the given date for a given stock is the number of shares for that stock on that date.
/**
 * Compute the composition of portfolio on each day of transaction.
 * A composition of portfolio contains:
 * - Amount of invested money so far (Deposit - Withdrawal)
 * - Amount of available cash
 * - Number of shares for each bought stock
 *
 * {
 *  invested: 10000,
 *  cash: 2001.42,
 *  APPL: 400,
 *  GOOGL: 500
 * }
 * @param {Array} transactions
 */
function computePortfolioByTransactionDate(transactions) {
  var portfolioByDate = {}
  var portfolioSnapshot = {
    invested: 0,
    cash: 0
  }
  for (var i = 0; i < transactions.length; i++) {
    var transaction = transactions[i]
    var tDate = transaction.date.toISOString().substring(0, 10)
    var tType = transaction.type
    var tSymbol = transaction.symbol
    var tAmount = transaction.amount
    var tShares = transaction.shares
    if (tType === 'BUY' || tType === 'SELL') {
      if (!portfolioSnapshot.hasOwnProperty(tSymbol)) {
        portfolioSnapshot[tSymbol] = 0
      }
      portfolioSnapshot[tSymbol] += Number(tShares)
    }
    if (tType === 'DEPOSIT' || tType === 'WITHDRAWAL') {
      portfolioSnapshot.invested += Number(tAmount)
    }
    portfolioSnapshot.cash += Number(tAmount)
    var portfolioCloned = {}
    Object.assign(portfolioCloned, portfolioSnapshot)
    portfolioByDate[tDate] = portfolioCloned
  }
  return portfolioByDate
}
The second step is to use historical prices of stocks to calculate their market values on a given date and hence to calculate eventually the Portfolio Value and Gain.
- Iterate each date starting from the first transaction date until today
- On each date, retrieve its composition
- On each date, for each stock whose number of shares is greater than 0, find the closing price on that date and multiply with the number of shares to determine its market value.
- On each date, the portfolio value is sum of the market value and available cash.
- On each date, the gain is the difference between the portfolio and the invested money.
- Write all those computed evolution data point in a sheet named Evolutions of 5 columns: Date, Invested Money, Cash, Market Value, Portfolio Value and Gain
/**
 * From the Transactions sheet and all historical prices sheets for all symbols:
 * - Compute daily evolution of the portfolio from the first transaction date
 * - Write evolutions into Evolutions sheet
 *
 * 'Date', 'Invested Money', 'Cash', 'Market Value', 'Portfolio Value', 'Gain'
 */
function generateDailyEvolution() {
  var transactions = extractTransactions()

  var portfolioByTransactionDate = computePortfolioByTransactionDate(transactions)

  var historicalPricesBySymbol = {}
  var symbols = extractSymbolsFromTransactions()
  symbols.forEach(symbol => {
    historicalPricesBySymbol[symbol] = getHistoricalPricesBySymbol(symbol)
  })

  var firstTransactionDate = transactions[0].date
  // var now = new Date()

  // Compute Evolutions
  var evolutions = [['Date', 'Invested Money', 'Cash', 'Market Value', 'Portfolio Value', 'Gain']]
  var portfolioSnapshot
  for (var aDate = firstTransactionDate; aDate <= new Date(); aDate.setDate(aDate.getDate() + 1)) {
    var dString = aDate.toISOString().substring(0, 10)
    var invested = 0
    var cash = 0
    var value = 0
    portfolioSnapshot = portfolioByTransactionDate[dString] ? portfolioByTransactionDate[dString] : portfolioSnapshot
    if (portfolioSnapshot) {
      for (const key in portfolioSnapshot) {
        switch (key) {
          case 'cash':
            cash = portfolioSnapshot.cash
            break
          case 'invested':
            invested = portfolioSnapshot.invested
            break
          default:
            var symbol = key
            var numShares = portfolioSnapshot[symbol]
            if (numShares > 0) {
              var priceOfSymbolOnDate = historicalPricesBySymbol[symbol][dString]
              if (priceOfSymbolOnDate) {
                value += numShares * priceOfSymbolOnDate
              } else {
                value = -1
                break
              }
            }
            break
        }
      }
    }
    if (value > -1) {
      var portfolioValue = value + cash
      var gain = portfolioValue - invested
      evolutions.push([new Date(aDate.getTime()), invested, cash, value, portfolioValue, gain])
    }
  }

  // Write the evolutions
  var spreadsheet = SpreadsheetApp.getActive()
  var sheetName = 'Evolutions'
  var sheet = spreadsheet.getSheetByName(sheetName)
  if (sheet) {
    sheet.clear()
    sheet.activate()
  } else {
    sheet = spreadsheet.insertSheet(sheetName, spreadsheet.getNumSheets())
  }

  sheet.getRange(1, 1, evolutions.length, 6).setValues(evolutions)
}
Test

It's the moment of truth:
- On the top menu bar of the Apps Script editor, select the function generateHistoricalPricesSheets
- Click on the Run button to execute the function. If you comeback to your spreadsheet, you will see newly created sheets for every symbol presented in the portfolio. Each sheet contains only to columns Date and Close
- On the top menu bar of the Apps Script editor, select the function generateDailyEvolution
- Click on the Run button to execute the function. If you comeback to your spreadsheet, you will see the sheet Evolutions is updated.
Add Portfolio Tools menu to the toolbar
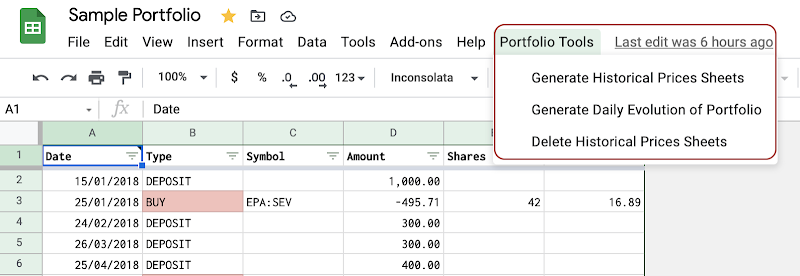
Whenever you add new transactions to your portfolio (no matter if it is a transaction made today or 2 years ago that you forget to add), you need to re-run the 2 about main functions: generateHistoricalPricesSheets and generateDailyEvolution. It might not be so convenient to open the Apps Script editor to execute functions as described above. In fact, we can add a menu directly on the menu bar of the spreadsheet and execute the functions directly there without going to the Apps Script editor. We just need to add the onOpen function below to add a menu named Portfolio Tools to the spreadsheet whenever it is opened:
/**
 * Add tab to the menu bar
 */
function onOpen() {
  var spreadsheet = SpreadsheetApp.getActive()
  var menuItems = [
    { name: 'Generate Historical Prices Sheets', functionName: 'generateHistoricalPricesSheets' },
    { name: 'Generate Daily Evolution of Portfolio', functionName: 'generateDailyEvolution' },
    { name: 'Delete Historical Prices Sheets', functionName: 'deleteHistoricalPricesSheets' }
  ]
  spreadsheet.addMenu('Portfolio Tools', menuItems)
}
Schedule daily
So far, we have automated successfully a big process which saves us several hours of detailed manual works. However, if you notice, there are still one manually thing you need to do, which is to trigger the script daily. We can effectively schedule the execution of the script daily, for instance, at 7 a.m before the opening of the market.
- Select the menu Triggers on the left side panel of the Apps Script editor
- Click the button + Add Trigger
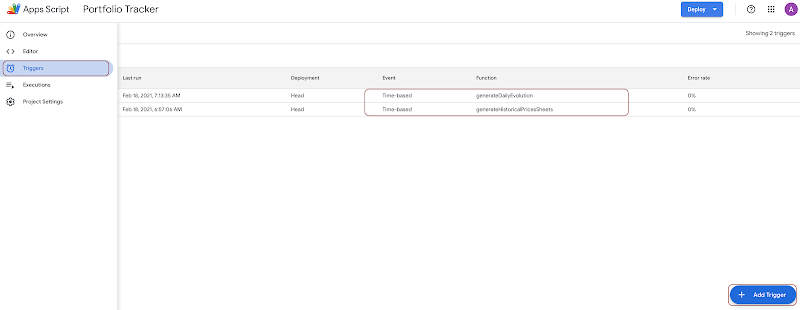
- Choose generateHistoricalPricesSheets for the select Choose which function to run
- Choose Time-driven for the select Select event source
- Choose Day timer for the select Select type of time based trigger
- Choose 6am to 7am for the select Select time of day
- Save the trigger
- Create another trigger with the same attributes for the function generateDailyEvolution
- Choose 7am to 8am for the select Select time of day to make sure that generateDailyEvolution is executed after generateHistoricalPricesSheets
- Save the trigger
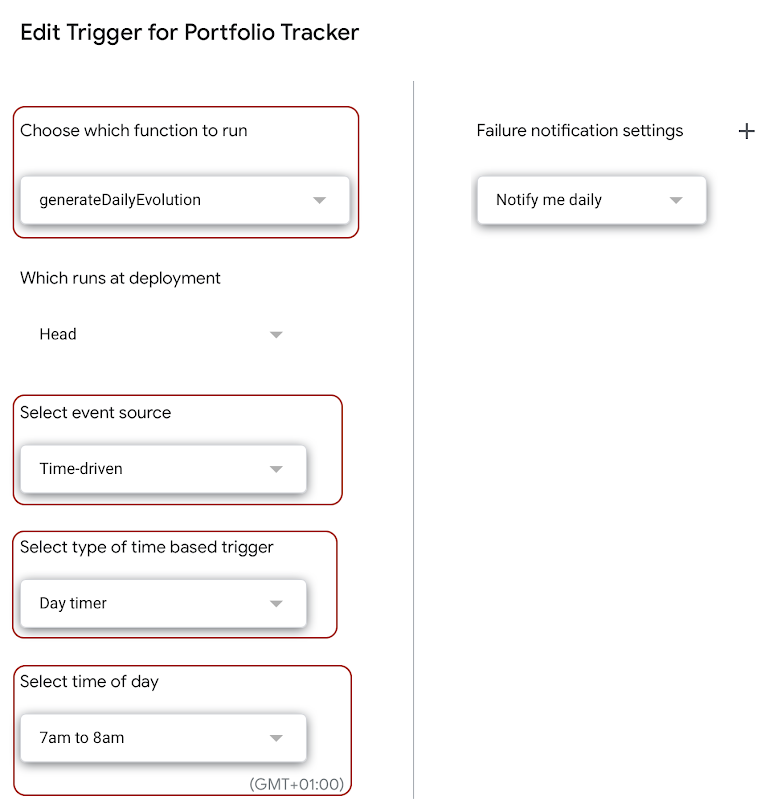
With the 2 triggers, every day, at 6am, a historical prices sheet is generated for each symbol presented in the portfolio. At 7am, the Evolutions sheet is computed and populated.
Conclusion
In this post, we have identified the need to compute daily evolutions of the portfolio. We then have found a solution with Google Sheets and its useful GOOGLEFINANCE function. We have made a step further with Google Apps Script to automate the process and schedule it daily. We can still do more, for example:
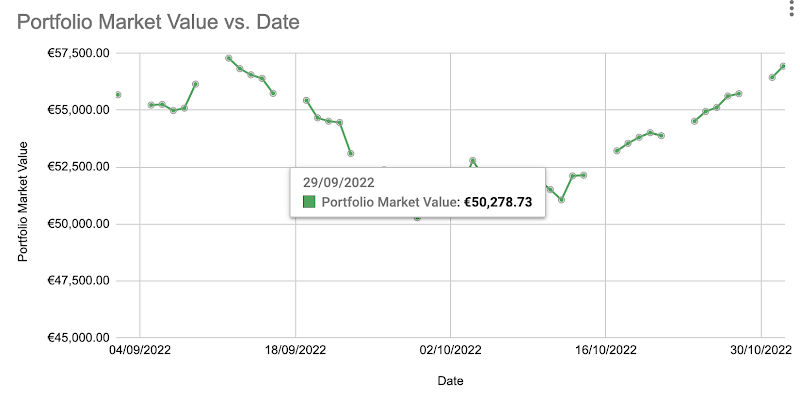
- Visualize those daily evolutions in a time-based graph within the dashboard in Google Data Studio
- Compare the evolution of portfolio with the evolution of market index over a same period of time
TLDR
- Make a copy of the demo spreadsheet that is available here
- Select Tools then Script editor from the menu bar to open Apps Script editor
- On the top menu bar of the Apps Script editor, select the function generateHistoricalPricesSheets
- Click on the Run button to execute the function. If you comeback to your spreadsheet, you will see newly created sheets for every symbol presented in the portfolio. Each sheet contains only to columns Date and Close
- On the top menu bar of the Apps Script editor, select the function generateDailyEvolution
- Click on the Run button to execute the function. If you comeback to your spreadsheet, you will see the sheet Evolutions is updated.
- Add the 2 triggers for the functions generateHistoricalPricesSheets and generateDailyEvolution
Note
To better understand the overall concept, please check out this post Create personal stock portfolio tracker with Google Sheets and Google Data Studio.
How to compute the daily evolution of a stock investment portfolio by simply using only the available built-in functions in Google Sheets
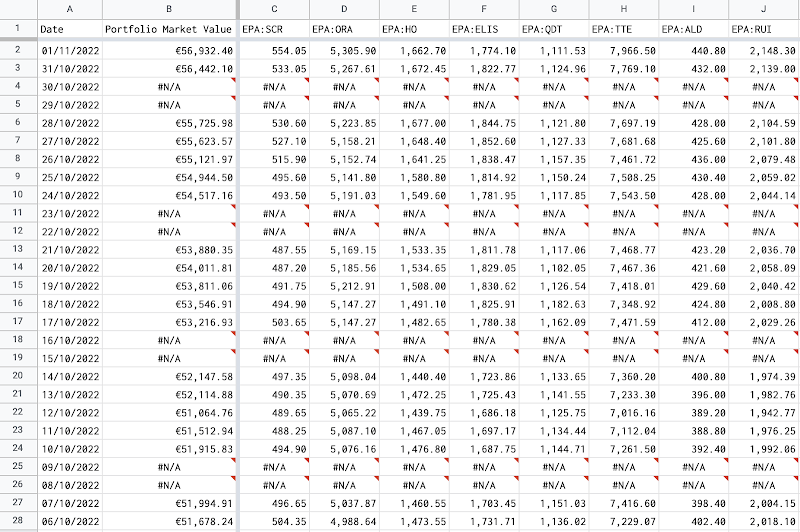
The solution explained in this post requires certain experiences in programming, especially with Google Apps Script. However, there is another solution using only built-in functions in Google Sheets. I have explained that solution in detail in the post How to compute the daily evolution of a stock investment portfolio by simply using only the available built-in functions in Google Sheets
References
- Google Apps Script
- Fundamentals of Apps Script with Google Sheets #2: Spreadsheets, Sheets, and Ranges
- Custom Menus in Google Sheets
Disclaimer
The post is only for informational purposes and not for trading purposes or financial advice.
Feedback
If you have any feedback, question, or request please:
- leave a comment in the comment section
- write me an email to allstacksdeveloper@gmail.com
Support this blog
If you value my work, please support me with as little as a cup of coffee! I appreciate it. Thank you!
Share with your friends
If you read it this far, I hope you have enjoyed the content of this post. If you like it, share it with your friends!

Thank you so much for your work, I am really impressed with all the possibilities we have on google sheets...
ReplyDeleteI was hoping you had a sample google sheet to calculate daily historical evolution?
Thank you,
David
Hi, thank you for your interest in creating a stock investment portfolio tracker with Google Sheets.
DeleteYes, I am impressed too with the capabilities of Google Sheets, that's why I am sharing what I know about that on this blog.
You can find the full demo about calculating the daily historical evolution of a stock investment portfolio in Google Sheets in this post https://www.allstacksdeveloper.com/p/lion-stock-portfolio-tracker.html#demo
I just want to let you know that I am working on a simpler solution for calculating the historical evolution of a stock investment portfolio in Google Sheets without writing complicated code with Google Apps Script. That solution uses only available built-in formulas of Google Sheets. So if that interests you, please stay tuned to this blog. I'll soon publish it.
I keep myself responsible in the WealthBee trading journal, which is crucial for maintaining consistency in trading. Since all transactions are recorded, there is no opportunity for impulsive choices or quick cuts. I have found that thinking about my transactions afterward helps me stay focused on my plans and control my impulses. You really need WealthBee's journaling tool if you're serious about improving your trading skills!
ReplyDelete