Monitor stock investment portfolio with Pivot table and GOOGLEFINANCE function in Google Sheets
As an investor, it is important to know the latest state of the stock portfolio. We need to know what stocks currently owned in the portfolio, how many shares for each one, how much dividend or gain contributed so far by each stock, etc. As we have registered stock transactions in a spreadsheet with Google Sheets, we can easily have the latest update from the stock portfolio by using pivot tables and GOOGLEFINANCE function.

Table of Contents
Use a pivot table to group transactions by symbols
The pivot table helps to see relationships between data points. To see how each stock contributes to the portfolio, we will create a pivot table that originated from the Transactions sheet.
- Select the Transactions sheet.
- Select the 5 columns A:E.
- In the menu at the top, click Data and then Pivot table.
- Select the newly created pivot table sheet, if it’s not already open.
- Rename the sheet as Positions or as you prefer.

Configure the pivot table Positions
The most essential information we want to know about a stock portfolio is how many shares there are for each stock. Let's configure then the pivot table Positions to answer that question based on data from the Transactions sheet:
- Select the Positions sheet where the pivot table is located.
- Select the cell A1 so that the Pivot table editor is displayed on the right-side panel.
- In the Rows section, click Add and select Symbol from the dropdown list. All symbols that appeared in transactions will be displayed in column A. Un-check the Show totals checkbox as it is not needed.
- In the Values section, click Add and select Shares from the dropdown list. To count the number of shares for each symbol, choose Sum in the Summarize by select box.
- As a transaction of type dividend has also a number of shares greater than 0, it is hence necessary to ignore that type of transaction to count correctly the number of shares for each symbol. In the Filters section, click Add and select Type from the dropdown list. Select then only 2 types BUY and SELL so that only transactions of those types are selected for the pivot table.

As a result, the Positions sheet is now showing the number of shares for each stock in the portfolio. If the number of shares is 0, it means that stock was sold out from the portfolio. If the number of shares is greater than 0, it means that stock is still owned in the portfolio.

Use GOOGLEFINANCE function to get real-time information for stocks
Having the number of shares for each stock in the portfolio is essential but it is not enough to manage efficiently the investment. We need to know the current price of each stock to evaluate how well each stock is performing. We might also need to know some basic financial information of companies to make a decision whether for buying or selling shares of a company.
Luckily, the built-in function GOOGLEFINANCE allows us to fetch that financial information directly into Google Sheets. For examples:
=GOOGLEFINANCE("NASDAQ:TSLA","price"): Get the current price for the stock of Tesla Inc=GOOGLEFINANCE("NASDAQ:TSLA","pe"): Get the current price / earning ratio for the stock of Tesla Inc=GOOGLEFINANCE("NASDAQ:TSLA","low52"): Get the 52-week low price for the stock of Tesla Inc=GOOGLEFINANCE("NASDAQ:TSLA","high52"): Get the 52-week high price for the stock of Tesla Inc=GOOGLEFINANCE("NASDAQ:TSLA", "price", DATE(2018,1,1), TODAY(), "DAILY"): Get all daily close prices from 01/01/2018 until today for the stock of Tesla Inc
So for each line in the Positions sheet, we have the symbol on column A, its number of shares on column B, its transactions in the Transactions sheet and a powerful GOOGLEFINANCE function let's see what we can derive from them:
| Column | Description | Formula |
|---|---|---|
| Price | the current price of the symbol (delayed by up to 20 minutes according to the official documentation) | =GOOGLEFINANCE(A2) |
| Market Value | the current market value by multiplying the current price of the symbol and its current number of shares in the portfolio | =B2*E2 |
| Change | how much the value for a stock has been changed since the previous trading's close | =GOOGLEFINANCE(A2,"change")*B2 |
| Change % | The percentage change in value since the previous trading day's close. | =GOOGLEFINANCE(A2,"changepct")/100 |
| Low 52 | The low-52 price | =GOOGLEFINANCE(A2, "low52") |
| High 52 | The high-52 price | =GOOGLEFINANCE(A2, "high52") |
| P/E | The price/earnings ratio | =GOOGLEFINANCE(A2,"pe") |
| Total Buy | the total money spent on buying shares of stock. It is computed by using SUMIFS to sum up all BUY transactions amount for that stock. | =SUMIFS(Transactions!D:D,Transactions!B:B,"BUY",Transactions!C:C,A2) |
| Total Sell | the total money received by selling shares of stock. It is computed by using SUMIFS to sum up all SELL transactions amount for that stock. | =SUMIFS(Transactions!D:D,Transactions!B:B,"SELL",Transactions!C:C,A2) |
| Cost | the total buy minus the total sell for the stock. If the current number of shares owned for a stock is 0, the cost will be the total buy amount. | =IF(B2>0,ABS(I2+J2),ABS(I2)) |
| Unit Cost | the cost for each share of stock. | =IF(B2>0,K2/B2,"") |
| Capital Gain | the un-realized gain if all shares are sold out or the realized-gain if all shares were sold out. It is the sum of the total buy, the total sell, and the current market value. | =I2+J2+H2 |
| Capital Gain % | The percentage of capital gain comparing to the cost | =N2/K2 |
| Total Dividend | the accumulated dividend received by owning shares of a stock. | =SUMIFS(Transactions!D:D,Transactions!B:B,"DIVIDEND",Transactions!C:C,A2) |
| Yield % | the percentage of dividend comparing to the cost. | =L2/ABS(K2) |
The columns are arranged in the way where:
- The first 3 columns Symbol, Shares, and P/E are fixed while scrolling horizontally or vertically.
- The Low 52, Price, Unit Cost, and High 52 columns are close to each other to evaluate quickly the current price compared to its historical prices and its unit cost.
- The Market Value, Total Buy, Total Sell, and Cost columns are close to each other to evaluate quickly the distribution.
- The Total Dividend, Yield %, Capital Gain, and Captial Gain % columns are close to each other to evaluate quickly the performance.
Conditional formatting columns
To have a good insight about the portfolio at a quick glance, we can apply conditional formatting for certain columns. As mentioned in their documentation, Google Sheets offers 2 types of conditional formatting, which are single color or color scale.
- Single Color: The columns Capital Gain and Change will be applied to the type of conditional formatting as their values are absolute. If the cell's value is greater than 0, the cell's color is green. If the cell's value is less than 0, the cell's color is red.

- Color Scale: The columns P/E, Yield %, and Capital Gain % will be applied to the type of conditional formatting as their values are relative. For instance, as the P/E is often used to evaluate how expensive a stock is, it is formatted such as the smaller it is, the greener is the cell's color.

Demo
You can take a look at the sample spreadsheet in this post to have an idea of how the data is organized and related. It is possible to make a copy of the spreadsheet to study it thoroughly.
Let's see if the created Positions sheet can answer our questions at the beginning:
- What are the stocks presented in the portfolio? The column Symbol gives the answer.
- How many shares are there for each stock? The column Shares gives the answer. The ENGI stock has 0 shares meaning that it was sold out from the portfolio.
- How much does worth each stock? The column Market Value gives the answer.
- How much dividend has been earned so far for each stock? The column Total Dividend and Yield % give the answer.
- How much gain has each stock made so far? The column Capital Gain and Capital Gain % give the answer.
Note
To better understand the overall concept, please check out this post Create personal stock portfolio tracker with Google Sheets and Google Data Studio.
References
- GOOGLEFINANCE function in Google Sheets
- Google Sheets reference: SUMIFS
- Google Sheets reference: Pivot table
Disclaimer
The post is only for informational purposes and not for trading purposes or financial advice.
Feedback
If you have any feedback, question, or request please:
- leave a comment in the comment section
- write me an email to allstacksdeveloper@gmail.com
Support this blog
If you value my work, please support me with as little as a cup of coffee! I appreciate it. Thank you!

Share with your friends
If you read it this far, I hope you have enjoyed the content of this post. If you like it, share it with your friends!


Awesome Work, need your help to understand Evolutions sheet. Is it manual work or you use any formula/settings to update Invested Money/Cash/Market Value/ Portfolio Value and Gain columns.
ReplyDeleteReally appreciate for your help.
Thanks.
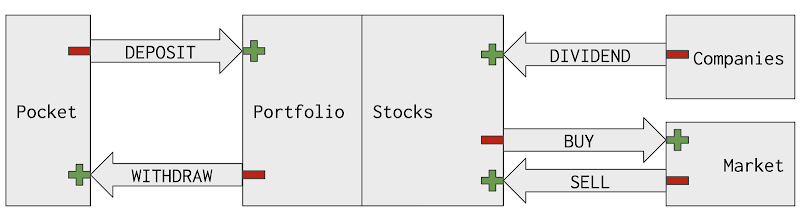
I use a small Google Apps Script program to do some complex computation, such as generating automatically the stock portfolio's daily change and comparing it with alternative investments.
DeleteFor your information, I have explained in details how to create a personal stock portfolio with Google Sheets and Google Data Studio in this post. https://www.allstacksdeveloper.com/p/lion-stock-portfolio-tracker.html
I hope it can help you.