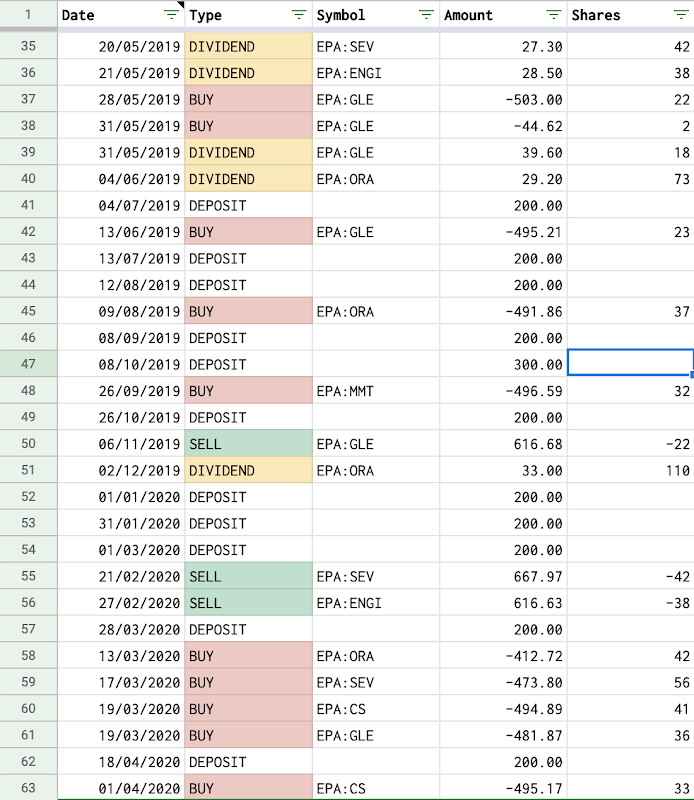
The first task of building a stock portfolio tracker is to design a solution to register transactions. A transaction is an event when change happens to a stock portfolio, for instance, selling shares of a company, depositing money, or receiving dividends. Transactions are essential inputs to a stock portfolio tracker and it is important to keep track of transactions to make good decisions in investment. In this post, I will explain step by step how to keep track of stock transactions with Google Sheets.

Table of Contents
Define the structure of transactions
In the example, I assume that a transaction generally has 5 main attributes:
-
Date: It is the moment when a transaction happened.
-
Type: It can be one of the following values:
- DEPOSIT: When money is added to the portfolio
- BUY: When money in the portfolio is used to buy shares of a company
- SELL: When money is added into the portfolio by selling shares of a company
- DIVIDEND: When dividend money is added to the portfolio by owning a stock
- WITHDRAWAL: When money is taken out of the portfolio
-
Symbol: It is the ticker symbol which is recognizable by the GOOGLEFINANCE function of Google Sheets
-
Amount: It represents the money value of the transaction. The amount can be negative or positive:
- Positive (+): Money goes into the portfolio. They are for transactions of type: DEPOSIT, SELL, and DIVIDEND
- Negative (-): Money goes out of the portfolio. They are for transactions of type: BUY and WITHDRAWAL
-
Shares: It represents the number of shares of a company involved in this transaction.
- It is only applicable for transactions of type BUY, SELL, and DIVIDEND.
- For DEPOSIT and WITHDRAWAL transactions, the cell is empty.
The number here can be negative or positive:
- Positive (+): Shares of a company are increased in the portfolio, i.e. buying.
- Negative (-): Shares of a company are decreased in the portfolio, i.e. selling.
Notes
-
In this tutorial, a transaction's amount is supposed to include by default fees if applicable.
-
As a dividend can be paid in stock or in cash, so, to keep it simple:
- If a dividend is paid in cash, it can be represented as a DIVIDEND transaction whose amount is greater than 0, and shares are greater than 0, but it does not mean more shares are added to the portfolio for this stock. It will help to know the amount of dividend for each share.
- If a dividend is paid in stock, there are 2 options:
- 1st: it can be represented as a BUY transaction whose amount is 0 and shares is greater than 0. It is considered as getting shares for free.
- 2nd: one can receive the dividend amount in cash and then use that cash to buy shares at the predefined price by the company. That means a dividend paid in stock can be represented by a DIVIDEND transaction and a BUY transaction. For example, on may 2019, I had 18 shares of Société Générale (EPA:GLE). The company distributed a dividend of 2.20 euros per share with two options: by cash or by stock at the price of 22.31 euros. With 18 shares, I received 39.60 euros of dividends, then I used this amount and extra money to buy 2 shares at 22.31 euros. Here are how I registered the transactions:
| Date | Type | Symbol | Amount | Shares |
|---|---|---|---|---|
| 31/05/2019 | BUY | EPA:GLE | -44.62 | 2 |
| 31/05/2019 | DIVIDEND | EPA:GLE | 39.60 | 18 |
Use Google Sheets to register transactions
With the definition for transaction above, we can now implement the solution with Google Sheets:
- Create new spreadsheet Portfolio
- Create new sheet Transactions
- Each attribute of a transaction is represented by a column
- Use the cells A1:E1 for names of the 5 attributes: Date, Type, Symbol, Amount, Shares
- Format the column A as Date time and columns D, E as Number
Demo
You can take a look at the sample spreadsheet in Demo stock portfolio tracker with Google Sheets to have an idea of how the data is organized and related. It is possible to make a copy of the spreadsheet to study it thoroughly.
Note
To better understand the overall concept, please check out this post Create personal stock portfolio tracker with Google Sheets and Google Data Studio.
References
Disclaimer
The post is only for informational purposes and not for trading purposes or financial advice.
Feedback
If you have any feedback, question, or request please:
- leave a comment in the comment section
- write me an email to allstacksdeveloper@gmail.com
Support this blog
If you value my work, please support me with as little as a cup of coffee! I appreciate it. Thank you!
Share with your friends
If you read it this far, I hope you have enjoyed the content of this post. If you like it, share it with your friends!

Hi, I find your blog really helpful as I'm building my own tracker too. May I ask if your tracker works for short selling too?
ReplyDeleteJ
Honestly, I cannot tell because I've never done short selling with my stock investment portfolio. You can try it yourself by putting your own short selling transactions in the stock investment tracker and see if it fits your expectations. Don't forget to share your result in a future comment! Thanks!
Delete